Data Visualization with Looker Studio


Looker Studio, formerly known as Data Studio, is your free gateway to transforming complex data into clear, interactive dashboards and reports. This user-friendly tool from Google empowers you to say goodbye to endless spreadsheets and create compelling data stories with charts, graphs, and maps. Looker Studio connects to various data sources, fosters collaboration, and allows viewers to delve deeper with interactive features.
Learning Outcomes
Visualize Your Data: Craft impactful charts and graphs, turning raw data into clear and insightful stories.
Unify Your Data Landscape: Connect to various sources, centralize your information, and gain a holistic view.
Interactive Exploration: Empower viewers to delve deeper with filters, drills-down, and dynamic controls.
Drag-and-Drop Simplicity: Build stunning reports with ease - no coding knowledge needed.
Collaborate & Share: Facilitate teamwork and data-driven decisions through real-time report sharing.
Who is this course for?
Business Professionals: Analysts, marketers, and anyone who needs to transform data into actionable insights for better decision-making.
Data Enthusiasts: Individuals with a basic understanding of data who want to learn how to effectively visualize and communicate it using Looker Studio.
Report Creators: Those who currently generate reports but want to elevate their game by creating clear, interactive dashboards with Looker Studio.
Anyone New to Looker Studio: Beginners with no prior Looker Studio experience will gain a solid foundation in using the tool to its full potential.
Tools you'll be familiar with
Course Outline
Session 01 : Data Studio to Looker Studio
Session 02 : Introduction to Business Intelligence & GDS
Session 03 : GDS Home Page Interface Walkthrough
Session 04 : How to Connect to Data Sources
Session 05 : Data Source Editor Interface Walkthrough
Session 06 : 4 Ways to Create Reports in GDS
Session 07 : Report Editor Interface Walkthrough
Session 08 : Creating Charts: Table, Pivot, Bar, Line, Maps
Session 09 : Adding Controls
Session 10 : Adding & Managing Pages & Navigation Options
Session 11 : Add Text, Shapes, URL, etc.
Session 12 : Groups & Page-Level vs. Report-Level Components
Session 13 : Regular Expressions (REGEX)
Session 14 : Sharing Options
Session 15 : Report Publishing and Versions
Session 16 : How to Get Help
Session 17 : Choosing the Right Chart
Session 18 : Tips to Create Effective GDS Reports
Your Trainer

Prince Patni
Senior Business Intelligence Analyst | RWS - Group
Prince Patni is a meticulous Data Analyst and Business Intelligence Developer with extensive experience in designing and developing dashboards, KPIs, and reports using Spotfire and SAP HANA. Currently a Senior Business Intelligence Analyst at RWS Group, he specializes in data visualization and advanced features like Iron Python scripting and R integration. He has held similar roles at Agilent Technologies and GENPACT for GE Aviation, excelling in data visualization, advanced analytics, and transforming manual reports into web analytics. Prince's background also includes stress analysis in aerospace engineering and business development.
Resource Person
Ready to unleash the power of your data?
This course is exclusively for Professional Members of the APIDM Membership Program.
Not a member yet? Join the APIDM Membership Program today!
Click here to learn more
Frequently Asked Questions
The duration for the Python Programming for Machine Learning program is 5 weeks including the time allocation for the final assessment.
Yes. We recommend this program for anyone who has the basic understanding of progrmming. However, anyone who wants to learn Python Programming for Machine Learning from basic to advanced can join the program.
Yes. There will be a comprehensive assessment at the end of the course to evaluate the learning progress of students.
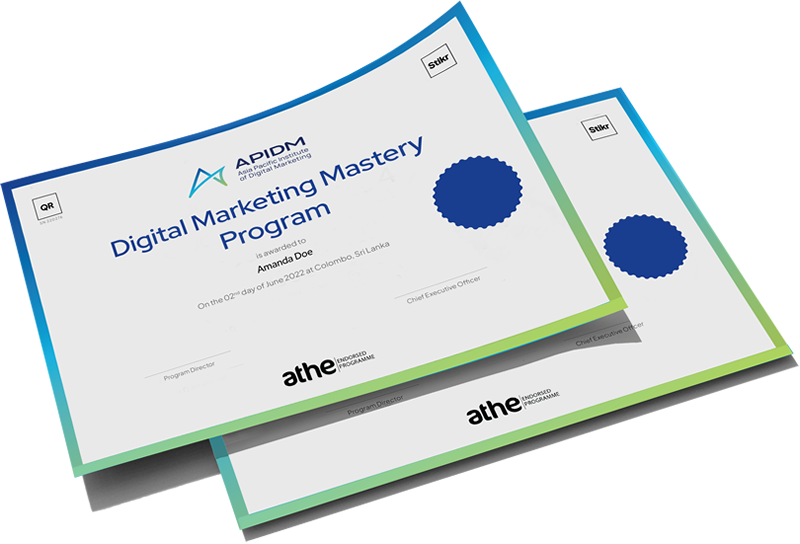
Yes. You will receive a printed certificate upon the successful completion of the program. Further, you will also be awarded an APIDM Qualified Digital Badge which will allow you to easily share on LinkedIn and other public platforms as a verification of your qualification.
