The Cash-Flow Mirage: Why Your Ad Dashboards Are Lying to You (And How to Fix It)
Have you checked your ad dashboards lately and felt like an absolute marketing genius?
Meta is reporting a 5x Return on Ad Spend (ROAS). Google Analytics shows graphs climbing up and to the right. The platforms are practically throwing you a victory parade.
But then you look at the actual company bank account, or you sync with your finance team, and the reality check hits hard. The net revenue isn’t matching the online celebration.
Why the disconnect? Because digital platforms are taking credit for sales that would have happened anyway.
If you are relying solely on standard platform metrics to allocate your marketing budget, you are operating in a dangerous blind spot. Between privacy restrictions like iOS 14+, cookie blocking, and platforms grading their own homework via “view-through” conversions, tracking has become a guessing game.
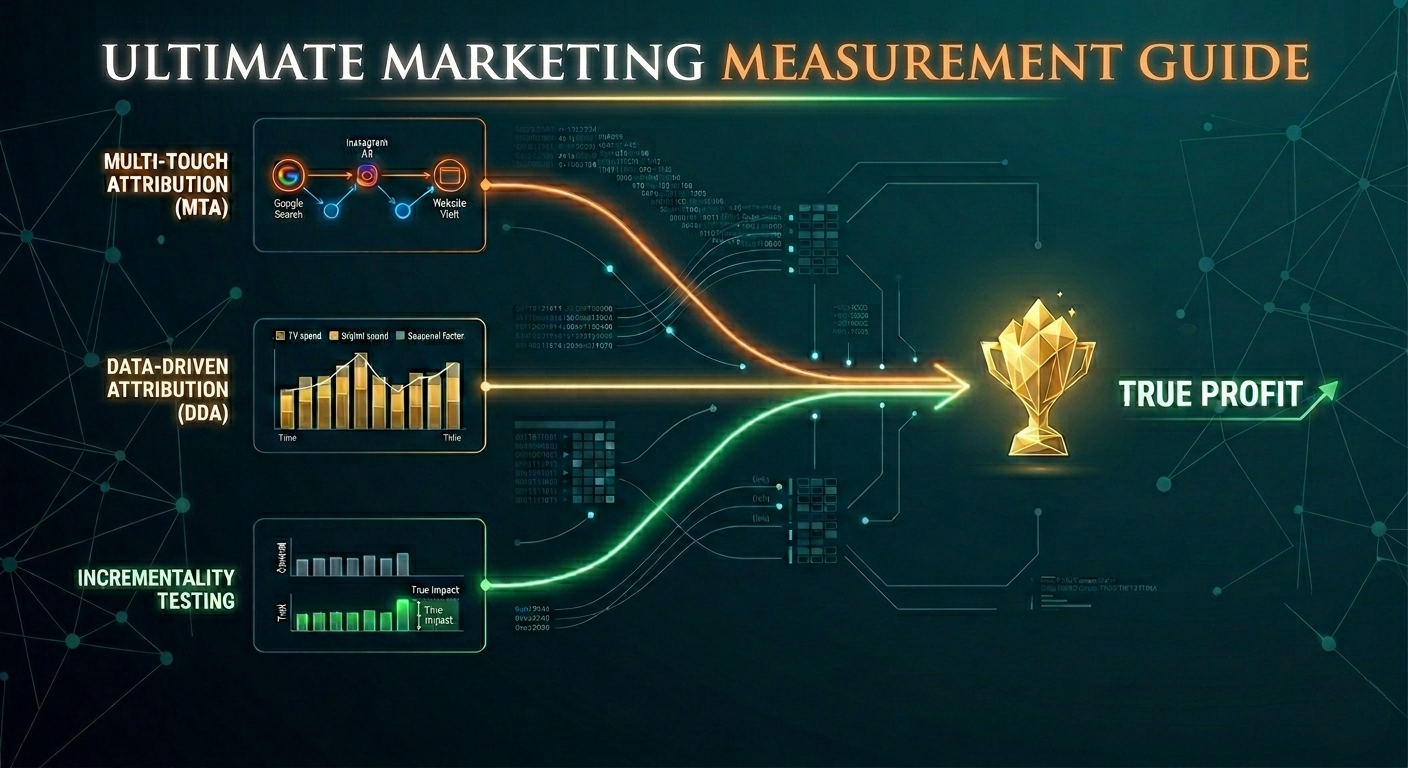
To survive and actually drive business growth, you have to move past basic dashboards and think like a marketing scientist. It is time to smash through the technical jargon and break down the three actual pillars of modern marketing measurement.
Let’s look at how they work, using a framework every sports fan will instantly understand.
The 2007 Sri Lankan Cricket Team: A Lesson in Measurement
When you look at a legendary sports lineup – like the iconic 2007 Sri Lankan cricket team – you have individual superstars. You have the explosive opening hitters, the rock-solid middle order of Sangakkara and Mahela, the finishing power of Dilshan, and the strategic bowling brilliance of Vaas and Muralitharan.
As a coach, if you only look at who scored the final run to win the match, you might give all the credit to the batsman who hit a boundary at the very end. But what about the opening bowler who took six wickets and choked the opposition’s run rate in the first place?
This is exactly how digital marketing channels operate. They work as a team. If you only measure the final click, you are bound to fire your best top-of-funnel players.
To truly understand who is driving your business growth, you need to master three distinct measurement frameworks.
1. Multi-Touch Attribution (MTA): Who Gets the Credit?
Multi-Touch Attribution is all about tracking the individual consumer journey. A user might discover you through a YouTube video, browse your products via a TikTok ad, search for you on Google a week later, and finally buy after clicking a retargeting ad on Instagram.
MTA asks: How do we distribute the credit among those touchpoints?
While machine-learning systems like Google Analytics 4 (GA4) use Data-Driven Attribution to hand out fractional credits, it has a massive blind spot. GA4 doesn’t truly know what happened inside Meta’s private video views or TikTok’s enclosed ecosystems.
The Quick Guide to MTA Models:
First-Click: Best if your core business goal is bringing in completely new users to the top of your funnel.
Last-Click: Useful if your management only cares about identifying the absolute final trigger that closes the sale.
Data-Driven: The best balance for understanding retention and complex consumer journeys, though still limited by privacy blocks.
2. Marketing Mix Modeling (MMM): What Contributed Globally?
While MTA looks at individual digital paths, Marketing Mix Modeling takes a massive step back. It looks at the macro picture. It evaluates everything – your digital spend, your traditional media (TV, radio, billboards), outdoor signage, and external factors like seasonality and economic shifts.
Historically, only enterprise giants like Coca-Cola or Nike could afford to run complex MMM calculations. But the landscape has shifted. With open-source tools like Google’s Meridian and the assistance of Large Language Models (LLMs), medium-sized businesses can now build their own models without a massive team of data scientists.
MMM doesn’t track cookies; it analyzes historical sales trends against your spending waves. It tells the coach whether it was the pitch conditions, the holiday season, or the specific combination of TV and digital ads that drove the ultimate victory.
3. Incrementality: Did Your Marketing Actually Cause the Result?
This is the ultimate test that keeps CFOs up at night. Imagine a fertilizer company tells you their product will double your crop harvest. To test it, you don’t just put it on all your trees and hope for the best.
You isolate your crops:
-
The Control Group: You give them regular water and sunlight, but zero fertilizer.
-
The Test Group: You give them the exact same water and sunlight, plus the fertilizer.
At harvest time, the control group gives you 100 apples. The test group gives you 150 apples. Those extra 50 apples are your true incrementality.
Incrementality testing measures whether a marketing activity created an additional sale that would not have happened otherwise. If you turn off your branded search ads on Google and your organic search traffic immediately captures those exact same conversions for free, your ads weren’t incremental. You were paying for sales you already owned.
The CEO’s Ultimate Dilemma
To bring this all together, let’s look at how these three frameworks answer fundamentally different questions for your leadership team:
| Measurement Framework | The Core Question It Answers | The Business Value |
| Multi-Touch Attribution (MTA) | Who gets the credit for the day-to-day conversion? | Optimizes tactical campaigns and creative assets. |
| Marketing Mix Modeling (MMM) | What macro factors and channels contributed over time? | Guides long-term budget allocation across channels. |
| Incrementality Testing | Did the marketing activity actually cause the revenue? | Eliminates wasted spend on non-incremental conversions. |
Here is a question to consider: If all three models give your CEO a different answer, which one should they trust?
The truth is, there is no single “perfect” model. The future of marketing science isn’t choosing one; it is a continuous cycle. You use MTA to manage your daily optimizations, employ MMM to plan your quarterly budgets, and run regular Incrementality tests to ensure your platforms aren’t overreporting your actual profits.
Stop Chasing ROAS, Start Chasing Profitability
At the end of the day, platforms don’t understand your shipping costs, your product margins, or your supply chain overhead. A $2 product and a $200 product look wildly different on your profit-and-loss statement, even if they show the exact same ROAS on a dashboard.
If you want to build a marketing framework that drives actual bottom-line profitability instead of platform vanity metrics, you need to upgrade your skills from execution to strategy.
Want to hear the full breakdown, real-world examples, and deep-dive insights from the panel discussion that inspired this guide? Watch the complete episode of the Performance Pod by APIDM on YouTube.
Ready to move past basic metrics and master real marketing science? Explore the APIDM Professional Programs to gain the practical, hands-on competencies needed to lead measurement frameworks that executives actually trust.